Orlando Inventory Levels Deep Dive: What Buyers and Sellers Should Know
Orlando Inventory Levels Deep Dive: What Buyers and Sellers Should Know
Orlando Inventory Levels Are Shifting — Here’s What It Means for You
Orlando inventory levels are at their highest point in over a decade, and whether you’re buying or selling in Central Florida right now, that matters enormously for your strategy.
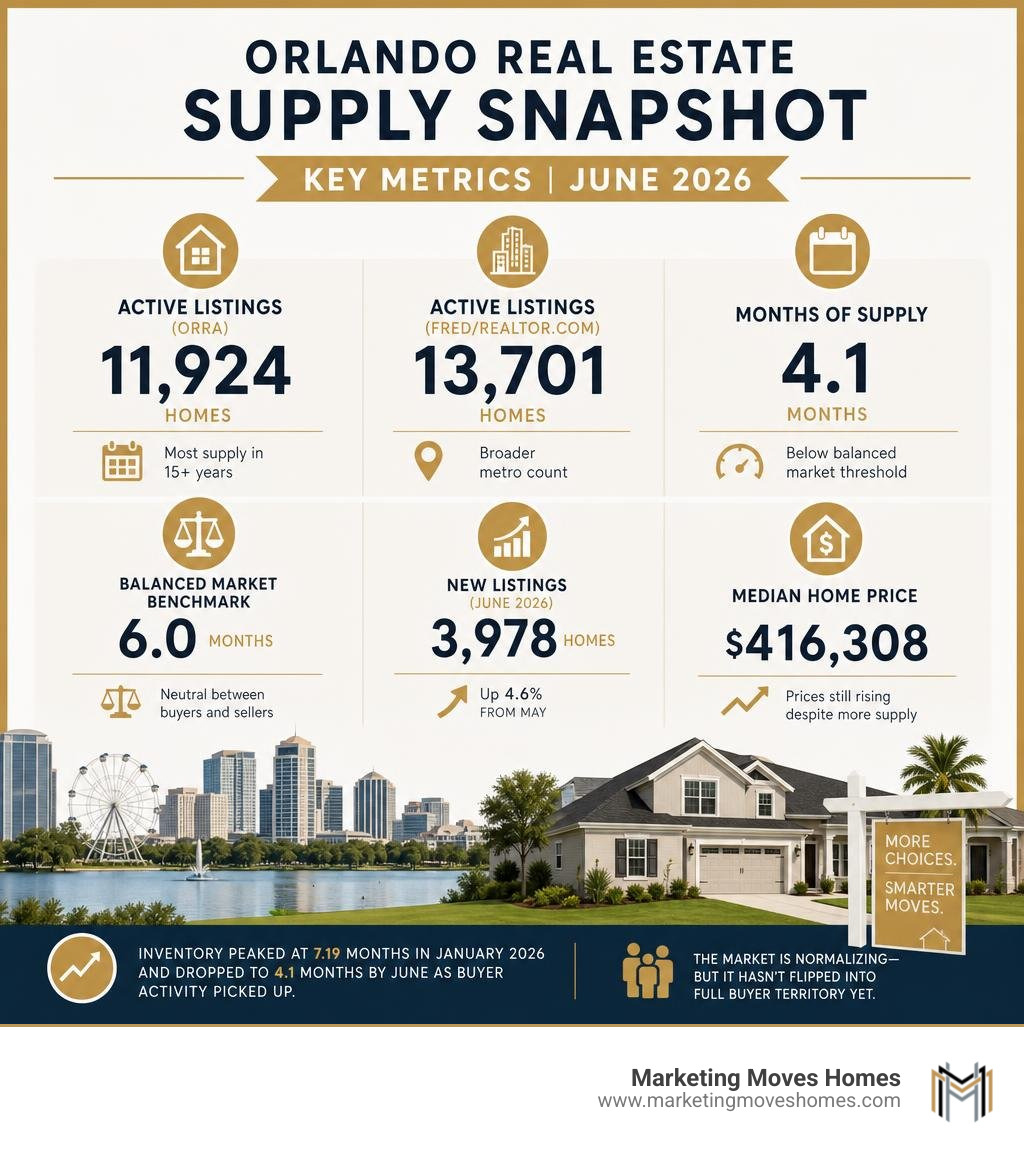
Here’s a quick snapshot of where the market stands as of June 2026:
| Metric | June 2026 Value | What It Means |
|---|---|---|
| Active listings (ORRA) | 11,924 homes | Most supply in 15+ years |
| Active listings (FRED/Realtor.com) | 13,701 homes | Broader metro count |
| Months of supply | 4.1 months | Below balanced market threshold |
| Balanced market benchmark | 6.0 months | Neutral between buyers and sellers |
| New listings (June 2026) | 3,978 homes | Up 4.6% from May |
| Median home price | $416,308 | Prices still rising despite more supply |
The market is normalizing — but it hasn’t flipped into full buyer territory yet. Supply peaked at 7.19 months in January 2026, then dropped back to 4.1 months by June as buyer activity picked up. That kind of swing changes everything about how you should price, negotiate, and time your move.
The full picture is more nuanced than any single headline suggests, and knowing where the leverage actually sits — by price band, by neighborhood, by property type — is what separates a good deal from a costly mistake.
I’m Scott Brazdo, MBA, a REALTOR® and Co-Founder of Marketing Moves Homes, and I’ve spent years combining deep digital marketing expertise with hyper-local Central Florida real estate knowledge to help buyers and sellers navigate shifting Orlando inventory levels with confidence. In the sections ahead, I’ll break down exactly what the data shows and what it means for your next move.
Basic Orlando inventory levels vocab:
Current State of Orlando Inventory Levels and Key Market Metrics
To truly understand Orlando inventory levels, we have to look past simple rumors and examine the official numbers. According to data from the Orlando Regional REALTOR® Association (ORRA), local available housing stood at 11,924 active listings in June 2026. That reflects a slight 0.1% uptick from May 2026 (11,914 listings) and continues a broader trend of expanding home options across Central Florida.
To put this in perspective, inventory in May had nudged down 1.9% from April’s 11,750 homes, while April had dipped 1.5% from March’s 11,592 homes. Early 2026 started with 11,741 listings in January and 11,975 in February. Over the long haul, these active figures represent the highest overall housing supply Central Florida has experienced since 2011.
However, available homes are only half of the story. The vital partner to total listings is the “months of supply” metric. In June 2026, Orlando’s supply dropped to 4.1 months, moving down from 4.4 months in May. In real estate economics, six months of supply serves as the universally recognized benchmark for a balanced market. Anything below six months gives sellers an edge, while anything above six months tilts the scales toward buyers.
For context on how these figures compare to local trade association releases and strategic market summaries, you can read the Orlando Housing Market Narrative or review our comprehensive Orlando market guide.
To see how raw property numbers translate into actual market dynamics, let’s examine how local listing feeds compare to federal economic datasets:
| Data Source | Geographic Coverage | June 2026 Count | What Is Included / Excluded |
|---|---|---|---|
| ORRA (Local MLS) | Orange, Seminole, Osceola, Lake & Volusia | 11,924 listings | Core local board activity, excludes pending sales |
| FRED / Realtor.com | Orlando-Kissimmee-Sanford MSA | 13,701 listings | Five-county metro broad mapping, excludes pending sales |
Understanding Data Discrepancies Between FRED and ORRA
When researching Orlando inventory levels, you will likely run across two distinct listing numbers that leave you scratching your head. For instance, in June 2026, the Federal Reserve Bank of St. Louis (FRED) reported 13,701 active listings, whereas ORRA reported 11,924 active listings.
Why is there a gap of nearly 1,800 homes?
The explanation comes down to mapping definitions and geographic boundaries:
- Geographic Coverage Area: The official FRED economic data series (ACTLISCOU36740) measures the full Orlando-Kissimmee-Sanford Metropolitan Statistical Area (MSA) relying on aggregated Realtor.com data. Local ORRA reports track residential transactions specific to member listings across Orange, Osceola, Seminole, Lake, and Volusia counties processed directly through the Stellar MLS portal.
- Status Filtering: Both datasets exclude pending sales (properties under contract waiting to close) to show actual available options. However, Realtor.com’s mapping algorithms, updated in late 2021 and late 2022, treat contingent statuses and duplicate property entries differently than local board reports.
- Property Classifications: Local MLS reports categorize single-family residential homes, condos, and townhomes into strict sub-categories, whereas federal economic research captures all available residential listings within broad regional boundaries.
You can inspect the raw macroeconomic figures directly on the official Housing Inventory Data series on FRED.
Months of Supply and Historical Supply Context
Measuring months of supply provides a clearer picture of market pace than total inventory counts alone. Months of supply calculates how long current inventory would last if no new homes were listed and purchasing continued at its current pace.
In January 2026, Orlando experienced a major supply spike, reaching 7.19 months of inventory with 11,741 active listings. That winter peak briefly pushed the market into buyer-leaning territory. However, as spring turned into summer, buyer demand absorbed available homes, pulling supply down to 4.4 months in May and 4.1 months in June 2026.
Despite this summer tightening, current inventory remains well above recent historic lows. For context, average monthly inventory throughout 2025 averaged 12,908 homes, up substantially from 10,289 in 2024. Furthermore, average Days on Market (DOM) hit 83 days in February 2026—the longest selling timeframe Central Florida has seen since February 2015.
This inventory expansion represents a long-awaited market normalization. Rather than signaling a market collapse, the growth in supply gives buyers breathing room to evaluate homes without making rushed decisions under high pressure.
Key Factors Influencing Central Florida Housing Supply
Orlando inventory levels do not rise or fall in a vacuum. A combination of economic forces, homeowner behavior, and regional migration shapes available inventory every month.
In June 2026, new listings rose 4.6% month-over-month, bringing 3,978 newly listed homes onto the market compared to 3,802 in May. This steady flow of sellers listing their properties highlights growing seller confidence despite shifting borrowing costs.
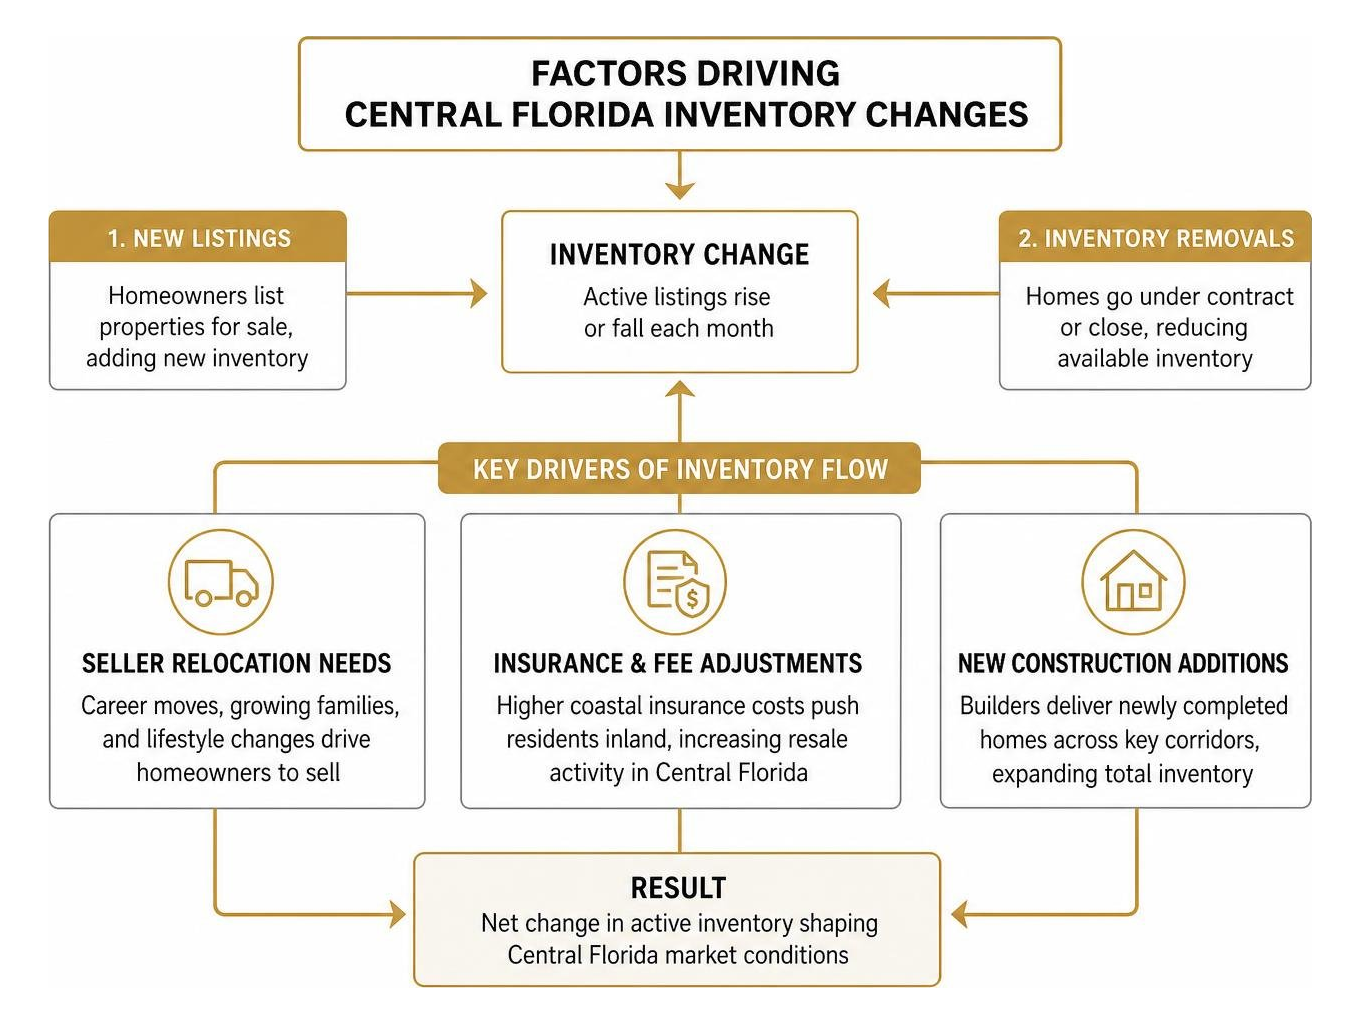
Three primary drivers dictate Central Florida’s ongoing inventory flow:
- Seller Relocation Needs: Homeowners moving for career opportunities, growing family space, or lifestyle transitions continue to drive resale inventory.
- Insurance and Fee Adjustments: Escalating homeowner insurance premiums across coastal Florida prompt many residents to relocate inland toward Greater Orlando, freeing up coastal inventory while spurring resale movement in Central Florida.
- New Construction Additions: Homebuilders across major corridors like Lake Nona, Winter Garden, and Horizon West continue delivering newly completed inventory, expanding options beyond standard resale properties.
Interest Rates and Buyer Purchasing Power
Mortgage interest rates remain a key factor shaping market supply and demand dynamics. As interest rates fluctuated between 5.9% and 6.5%, mortgage borrowing costs continued directly impacting buyer purchasing power.
For existing homeowners sitting on mortgage rates locked in at 3% to 4% during prior years, the decision to list requires careful financial math. This rate lock-in effect keeps some potential resale listings off the market. However, as interest rates stabilize around the 6% range, more homeowners are deciding that life changes outweigh holding onto a low mortgage rate.
Higher interest rates also alter buyer behavior. When rates rise, purchasing power drops, extending time on market for higher-priced properties and allowing inventory to accumulate. Conversely, whenever mortgage rates drop slightly, sidelined buyers re-enter the market and quickly absorb available homes. For an in-depth look at how interest rate movements interact with local real estate values, read our guide on Lake Nona Interest Rates and Home Prices.
Property Type Divergence: Single-Family Homes vs. Condos
Total Orlando inventory levels reveal important differences when broken down by property type. The balance between single-family detached homes and multi-family units (condos and townhomes) shows distinct operational trends:
Single-family homes enjoy strong demand. In June 2026, the median price for single-family detached homes in Orlando reached $451,922, driving the overall market median across all property types to $416,308.
Conversely, the condo and townhome segment faces unique supply pressures. Following Florida’s post-Surfside structural safety legislation, older condo buildings must maintain structural reserve funds and undergo mandatory engineering inspections. Combined with rising property insurance premiums and higher monthly HOA dues, these added costs have prompted more condo owners to list their units. As a result, multi-family inventory has accumulated at a faster pace, offering buyers substantial negotiating room in the condo market.
Localized Neighborhood Shifts and Price Band Dynamics
While metro-wide metrics offer a helpful high-level summary, real estate is hyper-local. Active supply numbers across the metro area obscure significant differences between price tiers and specific communities.
For instance, prime established areas such as Winter Park, Windermere, Dr. Phillips, and College Park show tighter inventory trends than broader suburban developments. Knowing your specific sub-market dynamics ensures you make well-informed pricing and offering decisions.
Sub-Market Analysis: Lake Nona and East Orlando Inventory Levels
Lake Nona—specifically within the 32827 and 32832 ZIP codes—presents a prime example of localized market performance. As a master-planned hub with top-rated schools, medical facilities, and premier community amenities, Lake Nona maintains steady homebuyer demand. To explore community features and neighborhood details, visit the official Lake Nona Community Information hub.
In Lake Nona and surrounding East Orange County corridors, supply metrics diverge based on property style and builder phase:
- Resale Single-Family Supply: Inventory remains tight in established neighborhoods like Laureate Park and Storey Park, where homes priced under $600K sell quickly when properly prepared and marketed.
- New Construction Standing Inventory: Builder spec inventory adds options for buyers who want move-in ready homes, giving purchasers leverage to request builder-paid interest rate buydowns.
- Luxury Housing Tiers: In higher price brackets ($800K and above), Days on Market stretches out, allowing buyers to request concessions and flexible closing terms.
For a thorough step-by-step approach to navigating home searches or sale preparation in this popular area, download our complete Lake Nona Real Estate Checklist.
Price Band Breakdown: Where Leverage Shifts to Buyers
Understanding Orlando inventory levels requires looking closely at performance across distinct price bands. The balance of leverage changes dramatically depending on market price points:
Here is how market conditions break down by price bracket:
- Under $400K: Inventory remains tight with 2 to 3 months of supply. Properties in this starter price tier move quickly, averaging 30 to 45 Days on Market with sale-to-list price ratios near 98% to 100%.
- $400K to $599K: Represents a balanced market environment with 4 to 5 months of inventory. Homes spend 45 to 60 days on market, giving buyers opportunities to request seller-paid closing cost assistance.
- $600K to $899K: Crosses into buyer-friendly territory with 6 to 8 months of supply. Days on Market averages 60 to 85 days, allowing buyers to negotiate interest rate buydowns and repairs.
- $900K+ Luxury Tier: Features over 9 months of supply and Days on Market exceeding 90 days. Buyers in this segment enjoy maximum leverage to negotiate price terms and custom timelines.
Strategic Real Estate Advice for Buyers and Sellers
Whether you plan to buy or sell, navigating shifting Orlando inventory levels requires a clear, strategic plan. As real estate advisors at Marketing Moves Homes, we help clients adapt their strategies to current market conditions. Discover how our approach works by reading about How Marketing Expertise Helps You Buy or Sell Real Estate in Orlando.
Tailored Listing Strategies for Sellers
In an environment with nearly 12,000 active listings, simply placing a sign in the yard and listing a home online is not enough. Standout properties require strategic preparation and maximum exposure.

Key strategies for home sellers in today’s market include:
- Accurate Strategic Pricing: Setting an accurate price right out of the gate is critical. Overpriced properties get overlooked, accumulate Days on Market, and usually end up selling for less after price cuts. Instead of relying on automated online estimate tools—which miss property condition, modern updates, and micro-neighborhood nuances—reach out to us for a personalized home valuation.
- Professional Listing Presentation: With abundant online options, high-end photography, cinematic video walkthroughs, and targeted digital promotion are essential to capture buyer interest before showings begin.
- Reviewing Net Sheets and Closing Costs: When evaluating cash or traditional offers, review the full seller net sheet, verified proof of funds, contingencies, and projected net proceeds rather than focusing only on the gross sale price.
Ready to position your property for a fast, profitable sale? Visit our List My Home page to get started.
Smart Purchase Negotiations in a Normalizing Market
With 4.1 months of supply metro-wide and expanded inventory in upper price tiers, buyers have more leverage today than in past years. However, successful negotiation requires a smart, structured approach.
Effective buyer strategies include:
- Requesting Interest Rate Buydowns: Instead of asking for a small price reduction, ask the seller for concessions to fund a temporary 2-1 rate buydown or a permanent mortgage rate buydown. This approach lowers your monthly mortgage payment significantly.
- Including Contingency Safeguards: Take advantage of normalized market conditions by securing comprehensive inspection windows (12 to 15 days) and establishing appraisal gap protection caps to keep your earnest money safe.
- Flexibility on Closing Terms: Align your offer timeline with the seller’s preferred move-out plans to create strong goodwill without increasing your purchase price.
If you are ready to explore available properties across Central Florida, explore our dedicated Buy a Home portal.
Navigating Future Trends in Orlando Inventory Levels
Looking ahead through the end of 2026, seasonal patterns and interest rate trends suggest that Orlando inventory levels will follow predictable cycles.
As autumn approaches, new listing volume typically moderates, leading to steady inventory absorption through the end of the year. Economists project interest rates will remain relatively steady between 5.8% and 6.4%, keeping buyer demand active across Central Florida. Working with experienced advisors who track these trends ensures you stay ahead of market shifts.
Frequently Asked Questions
How do supply metrics impact home values in Central Florida?
Housing inventory directly influences home value trends. When supply sits below 6 months—as seen with June 2026’s 4.1-month supply—demand continues absorbing inventory quickly enough to support modest price growth. That is why Orlando’s median home price held steady at $416,308 despite higher total active listings.
Why do active listing numbers differ between local MLS and federal sources?
Federal datasets like FRED aggregate broader metro-wide data (the Orlando-Kissimmee-Sanford MSA via Realtor.com) totaling 13,701 listings in June 2026. Local ORRA reports track transactions specific to regional board members across core Central Florida counties, recording 11,924 active listings. Both sources exclude pending sales to accurately reflect active market supply.
How does inventory supply in Lake Nona differ from metro averages?
Lake Nona (ZIP codes 32827 and 32832) experiences tighter resale inventory than metro-wide averages due to strong demand for local amenities, medical centers, and premier schools. While luxury price tiers ($800K+) offer expanded options, single-family homes under $600K maintain lower months of supply and move faster than broader metro numbers suggest.
Conclusion
Understanding Orlando inventory levels is essential for making smart real estate moves in Central Florida. With 11,924 active local listings (13,701 broad metro listings) and 4.1 months of supply, the market is finding a healthy, realistic balance. Sellers can achieve great results by pricing strategically and using professional listing marketing, while buyers can take advantage of expanded options and negotiating flexibility.
Navigating these shifting market dynamics requires hyper-local expertise, proven digital marketing strategies, and personalized guidance tailored to your goals. Whether you plan to buy or sell in Lake Nona, Winter Park, Windermere, Dr. Phillips, or anywhere across Greater Orlando, Marketing Moves Homes is here to guide you every step of the way.
To start your journey with a trusted local market expert, visit Explore Central Florida Real Estate with Marketing Moves Homes.